
Table of Contents
ToggleDELIMITATION, AND THE NORTH–SOUTH ECONOMIC DIVIDE
TOPIC: (GS2) POLITY: THE HINDU
Delimitation based solely on population could reduce the parliamentary influence of economically prosperous southern states.
North–South Divide
- Historical roots: Regional differences date to colonial-era investments, irrigation patterns and early industrialisation that favoured certain provinces, creating long-term divergence in infrastructure and human development.
- Demographic contrast: The Great Indian Plain (Hindi heartland) contains a large share of India’s population and higher fertility rates; Peninsular States have lower population growth and older demographic profiles.
- Income gap: Per capita income in many southern States is substantially higher — often two to three times — than in several northern States, reflecting different growth models and sectoral mixes.
- Human development: Southern States generally score better on literacy, life expectancy, maternal and child health; many districts in the Peninsula match upper‑middle‑income country indicators.
Key facts and trends
- Income gap: Per capita incomes in many southern States are roughly two to three times those in several northern States.
- Human development: States like Kerala and Tamil Nadu show higher literacy, health and life‑expectancy indicators compared with many Hindi‑belt States.
- Demographic weight: The Great Indian Plain (UP, Bihar, MP, Chhattisgarh, Jharkhand) holds a large share of the population and therefore parliamentary seats under current rules.
- Delimitation risk: A population‑based seat redistribution could reduce the South’s parliamentary share relative to the Hindi heartland.
Political and structural implications
- Representation mismatch: Wealth‑creating regions may lose influence over national policy and resource allocation.
- Risk of resentment: Perception of being treated as an “extractive” region could fuel regional alienation.
- Historical parallels: Similar centre‑periphery tensions have contributed to the breakup of federations in the past.
The South’s internal challenge
- Middle‑income trap: Southern growth is uneven and often benefits a narrow elite rather than broad‑based prosperity.
- Social deficits: Casteism, patriarchy and local inequalities persist despite high state GDPs.
- Institutional weakness: Weak rule of law and uneven human capital outcomes limit the South’s ability to convert wealth into inclusive development.
Way forward
- Delimitation reform: Consider digressive proportionality to balance population with state equality and protect minority prosperity.
- Inclusive growth: Southern States must invest in rural wages, district‑level education and health to reduce internal inequality.
- National dialogue: Promote sober, cross‑regional talks to build a social contract that links fiscal transfers to measurable development outcomes.
- Strengthen institutions: Improve governance, rule of law and public services across all regions to reduce the need for perpetual subsidies.
Factors Governing Delimitation
|
Conclusion
Bridging the fault line requires both constitutional imagination and social reform: fair political representation plus inclusive economic policies can prevent regional fracture and secure a cohesive future for India.
INDIA’S GROWTH AND DATA REALITY
TOPIC: (GS3) ECONOMY: THE HINDU
India’s headline GDP growth is under fresh scrutiny after a major study suggests two decades of mismeasurement.
India’s headline GDP growth
- A new study by Abhishek Anand, Josh Felman and Arvind Subramanian argues India’s growth figures since 2005 may have been misestimated, with post‑2011 growth possibly overstated by about 1.5–2 percentage points.
- The finding has reignited debate over data transparency, the treatment of informal activity in national accounts, and the credibility of economic policy claims.
key observations
- Study finding: The PIIE working paper finds India’s growth was underestimated in 2005–11 and overstated after 2011, implying a structural shift in measurement bias.
- Magnitude: The authors estimate a misestimation of roughly 1–2 percentage points annually in recent years — large enough to change policy conclusions.
- Measurement channel: Growth estimates increasingly rely on formal‑sector indicators, which can misrepresent an economy where a large share of workers are informal.
implications
- Policy distortion: Overstated growth can mislead fiscal, monetary and labour policies and delay corrective action.
- Public trust: Citizens judge the economy by wages, jobs and prices; a gap between headlines and lived reality erodes confidence in institutions.
- Investment signals: Misleading statistics affect investor decisions and the allocation of capital across sectors.
Way forward
- Restore statistical independence: Strengthen autonomous institutions and transparent release of surveys and census data.
- Improve informal‑sector measurement: Expand household and enterprise surveys, and integrate alternative data sources to capture cash and small‑scale activity.
- Publish raw microdata: Timely release of consumption, employment and firm‑level data to enable independent verification.
- Policy realism: Design social protection and job policies based on ground‑level indicators (wages, employment, consumption) not only headline GDP.
Conclusion
The PIIE study challenges the reliability of India’s growth narrative and calls for transparent, inclusive and methodologically robust statistics. Rebuilding credible data systems is essential for democratic accountability and for policies that actually improve livelihoods.
SOCIAL MEDIA ADDICTION TRIAL AND LEGAL ACCOUNTABILITY
TOPIC: (GS2) GOVERNANCE: THE HINDU
A U.S. jury found major social media platforms legally responsible for designing features that fostered addiction and harmed a young user, awarding $6 million in damages.
Background
- Case focus: Plaintiff argued that early and prolonged exposure to platform features caused anxiety, depression and body‑image issues.
- Verdict: Jury held platforms negligent and found evidence of conscious disregard; damages split 70% / 30% between the companies.
- Significance: The lawsuit treated social media as a consumer product whose design choices can create foreseeable harm.
Legal Section 230
- Section 230 context: Traditionally shields platforms from liability for third‑party content.
- New approach: Plaintiffs avoided Section 230 by alleging harm from platform design (feeds, algorithms, engagement loops), not from specific user posts.
- Legal test used: Negligence elements — duty of care, breach, causation and harm — and the “substantial factor” test for causation.
Key findings
- Design as cause: Jury accepted that features engineered to maximise engagement can be addictive and harmful to minors.
- Internal research: Evidence showed companies were aware of risks to young users but continued certain design practices.
- Consumer protection angle: Parallel verdicts have held platforms accountable for misleading safety claims and risky product decisions.
India’s regulatory framework (relevant provisions)
- IT Act, 2000: Prohibits harmful child content; mandates swift removal and reporting of offences.
- Digital Personal Data Protection Act, 2023: Requires verifiable parental consent for processing children’s data; restricts behavioural tracking and targeted ads for minors.
- SPDI Rules, 2011: Limit collection and disclosure of sensitive personal data.
- Capacity building: CERT‑In and ISEA run awareness and training programmes; collaboration exists with international bodies to block CSAM.
Way ahead
- Design accountability: Enforceable rules on addictive design elements, age‑appropriate defaults and algorithmic transparency.
- Stronger enforcement: Faster takedown, audits of platform safety claims and penalties for non‑compliance.
- Parental and school outreach: Scale digital literacy and mental‑health support for young users.
- Technical safeguards: Mandatory opt‑outs for personalised tracking, limits on autoplay and infinite scroll for minors.
Conclusion
The trial signals a global move to treat platform architecture as a public‑safety issue. Combining legal accountability, stronger regulation and user education is essential to protect children in the digital age.
WOMEN AND WATER MANAGEMENT
TOPIC: (GS1) SOCIAL ISSUES: THE HINDU
World Water Day highlighted the theme Water and Gender, urging a shift from seeing women as mere water carriers to recognising them as leaders in water governance.
Background
- Global access gap: About 2.1 billion people lack safe drinking water.
- Women in agriculture: Women make up nearly 41% of the global agri‑food workforce but face barriers to land, credit and technology.
- Economic case: Closing gender gaps in agriculture could raise productivity by up to 30% and reduce hunger for millions.
- Climate impact: Climate change hits agriculture hard; losses disproportionately affect women who manage household water and farm tasks.
- Local leadership: Projects show women’s involvement in watershed work improves water retention, crop yields and incomes.
Role of Women in Water Management
- Domestic managers: Women usually collect, store and use household water for drinking, cooking and hygiene.
- Agricultural managers: With male migration, women increasingly handle irrigation, livestock and small‑scale fisheries.
- Climate adapters: Women adopt drought‑resilient crops, water‑saving practices and local coping strategies.
- Community stewards: Women lead local water conservation, recharge and watershed restoration activities.
- Technical professionals: Growing numbers of trained women now work in water departments and research.
Key Initiatives and Examples
- REWARD programme: World Bank support for watershed projects with strong female participation.
- Crossing Boundaries: South Asian capacity building that trained women in integrated water resources management.
- National schemes: NMSA and other programmes prioritise women farmers in climate‑resilient agriculture.
- UN focus: International recognition such as the Year of the Woman Farmer boosts policy attention.
Challenges Faced by Women
- Exclusion from governance: Women are often absent from formal water boards and funding decisions.
- Limited resource rights: Lack of land titles restricts access to irrigation and credit.
- Technical gap: Women’s local knowledge is rarely integrated into scientific planning.
- Social barriers: Patriarchy, caste and mobility limits reduce women’s public participation.
- Climate burden: Falling groundwater and longer walks for water increase labour and safety risks.
Way Ahead
- Rights based approach: Treat water as a human right and mandate gender balance in water bodies.
- Capacity building: Scale technical training and leadership programmes for women.
- Gendered data: Collect and use sex‑disaggregated water data for planning.
- Finance access: Direct climate and irrigation funds to women’s groups and cooperatives.
- Institutional reform: Formalise women’s roles in irrigation, disaster response and water boards.
Conclusion
Empowering women in water management strengthens resilience, boosts productivity and makes water governance fairer and more effective.
DEEPENING INEQUALITY AND YOUTH EMPLOYMENT
TOPIC: (GS3) ECONOMY: THE HINDU
The State of Working India (SWI) 2026 report highlights a worrying “graduate paradox”: nearly 40% of graduates aged 15–25 are unemployed despite rising college enrolment.
State of Working India (SWI)
- Widening gaps in access to quality education, stable jobs and upward mobility across regions and social groups.
- Core issue: A university degree no longer guarantees decent employment, especially for marginalised youth.
Causes
- Structural mismatch: Economy is not creating enough quality jobs while colleges produce general degrees.
- Quality concentration: High‑quality institutions are clustered in the South; many northern states lack technical and vocational hubs.
- STEM shortfall: Too few qualified STEM teachers and poor faculty growth reduce technical talent.
- Dependence on government jobs: Many youths prepare for limited public vacancies instead of entering private work.
- Technological change: Automation and AI are eroding entry‑level roles traditionally filled by general graduates.
Key data
- Graduate unemployment: About 40% of graduates aged 15–25 are jobless.
- Low permanent jobs: Fewer than 7% of male graduates secure a permanent salaried job within one year of graduation.
- Youth joblessness: Unemployment for ages 15–29 is roughly 14.8%, much higher than the national average.
- Degree inflation: In 2023, 67% of unemployed 20–29 year‑olds were graduates (up from 46% in 2017).
- Social gap: Only 7% of ST and 10% of SC youth are graduates, versus over 18% in other groups.
Challenges
- Financial barriers: Professional courses are expensive and exclude poorer students.
- Training gaps: Many vocational programmes lack industry links; placement rates remain low.
- Missing middle: Weak manufacturing growth limits non‑farm job creation.
- Regional imbalance: Migration concentrates opportunities in a few states, leaving others behind.
- Employer reluctance: Firms underinvest in on‑the‑job training and convert few interns to full‑time staff.
Way forward
- Apprenticeship push: Large employer‑led apprenticeship programmes in organised manufacturing.
- Curriculum reform: Align higher education with industry needs; emphasise portfolios and demonstrable work.
- Decentralised hubs: Build MSME and industrial clusters in lagging regions.
- STEM mission: Recruit and train teachers to boost technical education quality.
- Portable social security: Cover gig and informal workers to reduce pressure for government jobs.
Conclusion
India must shift from mass degree production to a skills‑validated model that links learning to real work. Without urgent reforms, the demographic dividend risks turning into a social and economic burden.
KERALA’S MLATRACK.COM
TOPIC: (GS2) POLITY: THE HINDU
Kerala launched MLATrack.com, the country’s first public portal that compiles and displays the legislative work of state MLAs (2021–2026).
MLATrack.com
- Public database: Centralised online repository of MLA performance and assembly activity.
- Coverage: Records questions, debates, motions and other interventions with dates and links to official replies.
- The platform aims to boost accountability by making attendance, questions and interventions easily accessible to citizens and researchers.
Key features
- MLA profiles: Biodata, constituency maps, attendance and participation logs.
- Legislative tracker: Searchable list of 68,000+ questions, debates and motions.
- Visual tools: Dashboards and charts for quick analysis.
- Source links: Direct hyperlinks to assembly records and official responses.
Significance
- Transparency: Enables voters to assess representatives on objective metrics.
- Evidence‑based debate: Supports media, researchers and civil society with primary data.
- Civic engagement: Lowers information barriers for public scrutiny and informed voting.
Conclusion
MLATrack.com strengthens democratic accountability by making MLA performance transparent and it can deepen civic engagement, improve legislative oversight, and encourage evidence‑based governance.
ZOJILA PASS
TOPIC: (GS1) GEOGRAPHY: THE HINDU
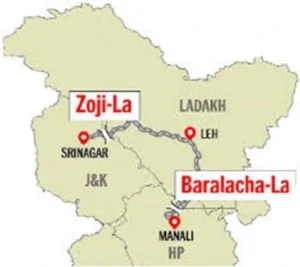
An avalanche struck Zojila Pass, killing five people as several vehicles were buried under snow and the highway was closed. Rescue teams and disaster agencies have been mobilised and relief operations are underway.
Zojila Pass
- Location: High mountain pass linking the Kashmir Valley with Ladakh.
- Strategic importance: Major land route for civilian traffic and military logistics between Srinagar and Leh.
- Altitude and climate: Located at high elevation with heavy winter snowfall and frequent storms; prone to sudden weather changes.
- Seasonal access: The pass is often closed in winter due to snow and avalanches; reopening requires clearance and safety checks.
About avalanches
- Definition: Rapid downhill flow of snow, ice and debris that can bury people, vehicles and infrastructure.
- Common triggers: Heavy snowfall, rapid temperature change, wind‑deposited snow, earthquakes, or human activity (e.g., vehicles, blasting).
- Types: Slab avalanches (most dangerous), loose‑snow avalanches, and wet avalanches.
- Hazards: Burial, trauma, hypothermia, road blockages and secondary accidents.
Immediate response and agencies
- Rescue mobilisation: Local administration, police, disaster response forces, Border Roads Organisation and medical teams coordinate search and rescue.
- Relief actions: Evacuation of survivors, medical aid, clearing of snow, and temporary shelter for stranded travellers.
- Traffic management: Highway closure, diversion of vehicles and advisories for travellers.
Mitigation and preparedness
- Early warning: Weather forecasting, avalanche risk mapping and real‑time alerts for travellers.
- Engineering controls: Snow galleries, avalanche barriers, controlled blasting and regular slope stabilisation.
- Operational readiness: Pre‑positioned rescue teams, trained local responders and stockpiled equipment.
- Community measures: Traveller advisories, mandatory convoy systems, and training for first response.
Conclusion
Avalanches at high passes like Zojila highlight the need for robust forecasting, engineering safeguards and rapid multi‑agency response to reduce loss of life and restore vital connectivity.
AI TOKENS
TOPIC: (GS3) SCIENCE AND TECHNOLOGY: THE HINDU
The AI industry is shifting to tokenomics, where the cost per token is the main competitive measure for model providers and cloud services.
What are AI tokens?
- Definition: A token is the smallest unit of text an LLM processes — it can be a character, part of a word, or a whole word. AI token costs are becoming the central economic metric in generative AI
- Tokenisation: Input text is split into tokens, each mapped to a numeric ID the model uses for prediction.
- Reports note that Chinese models and providers are offering lower token prices, giving them an edge for large‑scale AI agents and background automation.
How token processing works
- Tokenise: Break prompt into tokens.
- Encode: Convert tokens to vectors (numeric IDs).
- Predict: Model computes the next token probabilities.
- Decode: Tokens are converted back to readable text.
Key technical features
- Context window: Models have limits (e.g., tens of thousands of tokens) that cap how much text they can “remember.”
- Statelessness: Models need prior tokens resent to maintain conversation context.
- Language variance: Token counts vary by language and script, affecting cost.
Economic and strategic significance
- Pricing unit: Providers bill by input and output tokens; lower per‑token prices reduce operating costs for AI agents.
- Competitive edge: Countries or firms that offer cheaper tokens can attract high‑volume AI workloads and scale automated agents faster.