
Table of Contents
ToggleBUILDING ON A TAX THAT DID NOT PAY OFF
TOPIC: (GS3) ECONOMY: THE HINDU
The Union Budget 2026-27 has been criticised for continuing earlier strategies despite revenue shortfalls. Analysts argue that the government’s 2025 tax gamble failed, leading to expenditure cuts and missed opportunities.
Background
- Budget 2025-26 introduced a major income tax cut for the middle class, expecting higher compliance and rising incomes to offset losses.
- Reality: Income tax collections fell short by ₹1.26 lakh crore; GST collections also missed targets by ₹1.31 lakh crore.
- Overall gross tax revenue shortfall: ₹1.92 lakh crore.
- Result: Expenditure cuts across sectors including agriculture, education, health, rural and urban development, and even capital expenditure.
Key Features of Budget 2026
- Focus on fiscal prudence and capital expenditure.
- Supply-side measures for employment and credit guarantees for MSMEs.
- Continuation of earlier macroeconomic approach without major innovation.
- Heavy emphasis on infrastructure capex (highways, freight corridors) rather than developmental capex (health, education, agriculture).
Accessible Tourism – Kerala’s Initiative
- Accessibility Framework – Kerala aims to integrate accessibility across the tourism value chain, from infrastructure to digital platforms, making tourism more inclusive and equitable.
- Tourism Growth – In 2024, the State recorded 2.25 crore domestic tourists, generating revenue of over ₹49,000 crore, surpassing pre-COVID levels.
- New Experiences – Kerala is introducing seaplane, caravan, and heli-tourism initiatives to diversify visitor experiences and attract more tourists.
- Social Impact – Responsible tourism has created local job opportunities and promoted women’s empowerment, reflecting the State’s inclusive development model.
Tax Devolution Share – 16th Finance Commission
- States’ Share Fixed – Devolution share remains 41%, as Centre’s cesses and surcharges already reduced the divisible pool.
- New Formula – Population weightage raised to 17.5%, demographic performance cut to 10%, area reduced to 10%, forest cover stays at 10%, and per capita GSDP difference set at 42.5%.
- State Gains – Andhra Pradesh, Karnataka, Kerala, Tamil Nadu, and Telangana all see higher shares compared to earlier allocations.
- Policy Signal – Formula balances equity and efficiency, rewarding poorer States while adjusting demographic and area factors.
Criticisms
- Employment Concerns: Youth unemployment remains high; women’s participation, especially in urban areas, is very low.
- Capex Imbalance: Infrastructure spending overshadowed social sector investments that generate jobs and demand.
- Missed Opportunity: No major focus on pollution control, despite public protests in Delhi making it a political issue.
- Lack of Imagination: Continued reliance on supply-side measures without boosting domestic demand.
Suggested Alternatives
- Relax hawkish fiscal stance for this uncertain year.
- Prioritise employment-intensive development expenditure (education, health, agriculture).
- Strengthen welfare spending with multi-round demand effects.
- Launch a national mission against pollution, addressing a pressing public concern.
Conclusion
The 2026 Budget continues earlier strategies despite revenue shortfalls, risking weak demand and missed social priorities. A more balanced approach focusing on jobs, welfare, and environmental action is essential for inclusive growth.
UNION BUDGET ON DOMESTIC MANUFACTURING
TOPIC: (GS3) ECONOMY: THE HINDU
The Union Budget 2026-27 has been presented in Parliament, focusing on domestic manufacturing, tariff reforms, and self-reliance.
Global backdrop:
- Geopolitical tensions during Donald Trump’s second term disrupted trade norms.
- High tariffs on India’s labour-intensive exports to the U.S. hurt competitiveness.
- India seeks closer ties with the European Union through a major FTA.
- Import dependence on China persists despite policy efforts since 2020.
- China has restricted exports of critical minerals and EV-related technologies, adding pressure on India.
Budget 2026 Highlights
Manufacturing Sector Push
- Recognises India’s premature deindustrialisation: Manufacturing share in GDP stagnant or declining. Employment in manufacturing falling.
- Official GDP data for manufacturing seen as overstated; ASI data shows slower growth.
- Fixed investment growth modest, eroding industrial capacity.
Tariff & Trade Reforms
- Corrects inverted duty structures by reducing customs duties on capital and intermediate goods.
- Rationalises import procedures to reduce delays and improve ease of doing business.
Electronics & Rare Earths Strategy
- Focus on electronics parts and sub-assemblies, India’s largest import dependence on China.
- Proposal for a rare earths corridor across Odisha, Kerala, Andhra Pradesh, and Tamil Nadu.
- Tax exemptions extended for lithium-ion cell production and related capital goods.
MSME Support
- Emphasis on labour-intensive goods to offset U.S. tariffs.
- Promotion of new MSME clusters and modernisation of 120 legacy clusters.
- Financial assistance for MSMEs to access capital markets.
Challenges
- Premature deindustrialisation with stagnant manufacturing share and declining employment.
- Falling FDI inflows and weak investment in high-tech industries.
- Persistent import dependence on China, especially for electronics and critical minerals.
- Policy gaps such as allowing SEZ sales domestically instead of boosting exports.
- Centre–State fiscal coordination issues left unaddressed.
Way Forward
- Strengthen domestic value chains through targeted incentives in high-tech and strategic sectors.
- Promote FDI in technology-intensive industries with stable policies and ease of doing business.
- Enhance MSME competitiveness via credit access, skill development, and cluster modernisation.
- Invest in inclusive infrastructure beyond metros, focusing on logistics, energy, and local manufacturing hubs.
New Categorisation of MSMEs (2025 Revision)
Micro Enterprises
- Investment limit: Up to ₹2.5 crore in plant & machinery/equipment.
- Annual turnover: Up to ₹10 crore.
- Earlier limit: ₹1 crore investment and ₹5 crore turnover.
Small Enterprises
- Investment limit: Up to ₹25 crore.
- Annual turnover: Up to ₹100 crore.
- Earlier limit: ₹10 crore investment and ₹50 crore turnover.
Medium Enterprises
- Investment limit: Up to ₹250 crore.
- Annual turnover: Up to ₹500 crore.
- Earlier limit: ₹50 crore investment and ₹250 crore turnover.
Conclusion
The Budget rightly prioritises self-reliance and manufacturing revival, but success hinges on attracting investment and reducing dependence on imports. A balanced strategy combining high-tech growth with MSME support is essential for sustainable industrialisation.
UNION BUDGET 2026 AND URBAN INDIA
TOPIC: (GS3) ECONOMY: THE HINDU
The Union Budget 2026 reduced central allocations for urban development by 11.6%, sparking debate on the government’s commitment to cities.
Importance of Urban Development
- Cities contribute nearly two-thirds of India’s GDP and act as hubs for jobs, innovation, and services.
- Rapid urbanisation has stressed housing, transport, sanitation, water supply, and governance systems.
- Urban Local Bodies (ULBs) remain fiscally weak, dependent on central and state transfers.
- The 74th Constitutional Amendment Act envisioned empowered municipalities, but inadequate devolution of funds, functions, and functionaries limits autonomy.
- Central schemes like PMAY-Urban, AMRUT, Swachh Bharat Mission-Urban, and metro projects were designed to fill these gaps.
Financing Framework
- Urban development financed through central allocations, state budgets, municipal revenues, and borrowing.
- Centrally Sponsored Schemes (CSS) dominate housing, sanitation, water supply, and mobility.
- Metro rail projects consistently supported, but basic services (buses, waste management, drainage) rely on predictable funding.
- Rising climate risks (heatwaves, floods, water scarcity) make resilient urban infrastructure a macroeconomic necessity.
Budget 2026 – Allocation Trends
- Central outlay reduced from ₹96,777 crore to ₹85,522 crore (11.6% cut).
- Real decline sharper after inflation adjustment.
- Signals a shift where urban development is treated as residual, not growth-critical.
Skewed Priorities
- Metro and mass rapid transit systems: ₹28,740 crore (one-third of allocation).
- Metro projects are capital-intensive, spatially limited, and benefit mainly formal commuters.
- Bus transport, non-motorised mobility, and last-mile connectivity—used by most residents—receive limited support.
- Reflects bias towards high-visibility projects over inclusive solutions.
Cuts in Flagship Schemes
- PMAY-Urban: ~6% cut despite housing shortages.
- Swachh Bharat Mission-Urban: Allocation halved, risking sanitation gains.
- AMRUT: 20% reduction, even as cities face water stress and ageing infrastructure.
Implications
- No compensation through greater fiscal devolution or enhanced municipal revenue powers.
- ULBs remain constrained in long-term planning and service delivery.
- Weakening urban investment undermines India’s growth aspirations.
- Globally, successful economies rely on well-funded, inclusive cities.
- Treating urban development as a cost centre risks long-term economic and social setbacks.
Conclusion
The spending cuts in Union Budget 2026 signal a policy bias towards high-visibility projects like metros while neglecting everyday urban needs. Without stronger investment in inclusive urban services, India’s cities may struggle to sustain growth and resilience.
NEW FISCAL RULE IMPLICATIONS FOR GROWTH AND SPENDING
TOPIC: (GS3) ECONOMY: THE HINDU
The Union Budget 2026–27 is guided by a new fiscal rule that prioritises the debt-to-GDP ratio over the fiscal deficit.
Background
- India has followed fiscal discipline since the FRBM Act, 2003, which set fiscal deficit targets.
- The new fiscal rule shifts focus to the debt-to-GDP ratio, targeting 50% by 2031 (higher than FRBM’s 40%).
- Current debt levels exceed the target, prompting deficit reduction measures.
Fiscal Strategy in FY27
- Deficit Targets: Primary deficit reduced from 0.8% (FY26) to 0.7% (FY27). Fiscal deficit reduced from 4.4% (FY26) to 4.3% (FY27).
- Revenue Trends: Non-debt receipts projected to fall to 9.3% of GDP (from 9.5% in FY26). Decline mainly due to lower GST and indirect tax collections.
- Expenditure Trends: Total expenditure-to-GDP ratio reduced from 13.9% (FY26) to 13.6% (FY27). Capital expenditure remains steady at 3.1% of GDP.
- Revenue expenditure cut sharply, continuing the trend of favouring capital spending.
Impact on Development Expenditure
- Development expenditure (social sector + economic services) reduced to 5.7% of GDP (FY27) from 6.1% (FY26).
- Rural development and agriculture spending declined to 1.2% of GDP (FY27) from 1.5% (FY26).
- Major cuts in rural employment programmes.
- Positive demand effect of lower GST/indirect taxes offset by reduced rural/agricultural spending.
Key Concerns
- Weak Investment Stimulus; Corporate investment remains low due to global demand slowdown. Fiscal policy provides little support to revive private investment.
- Distributional Imbalance; Adjustment burden falls on rural and social sector spending. Corporate tax-to-GDP ratio remains unchanged at pre-COVID levels.
Significance
- New fiscal rule provides greater fiscal space compared to FRBM, but consolidation strategy continues.
- Cuts in rural/agricultural spending may undermine employment, demand, and inclusive growth.
- Raises debate on balancing fiscal discipline with developmental priorities.
Debt-to-GDP Ratio and Fiscal Deficit
Debt-to-GDP Ratio
- It measures a country’s total government debt compared to its Gross Domestic Product (GDP).
- Formula: Debt-to-GDP Ratio=Total Government DebtGDP×100
- Purpose: Shows how sustainable a country’s debt is relative to the size of its economy.
- Interpretation:
- A high ratio means the government may struggle to repay debt without affecting growth.
- A low ratio indicates healthier fiscal space and better creditworthiness.
- Example (India): India’s debt-to-GDP ratio is targeted at 50% by 2031 under the new fiscal rule, compared to the earlier FRBM target of 40%.
Fiscal Deficit
- Definition: Fiscal deficit is the gap between the government’s total expenditure and its total revenue (excluding borrowings).
- Formula: Fiscal Deficit=Total Expenditure−(Revenue Receipts+Non-debt Capital Receipts)
- Purpose: Indicates how much the government needs to borrow to meet its spending commitments.
- Interpretation:
- A higher fiscal deficit means more borrowing, which can increase debt and inflationary pressures.
- A lower fiscal deficit reflects better fiscal discipline.
- Example (India): In FY 2026, India’s fiscal deficit was 4.4% of GDP, targeted to reduce to 4.3% in FY 2027 under the new fiscal consolidation plan.
Conclusion
The new fiscal rule strengthens fiscal discipline by focusing on debt sustainability, but its reliance on cutting rural and social sector spending risks undermining inclusive growth. A balanced approach is needed to ensure stability without sacrificing development priorities.
UNION BUDGET 2026–27 – FISCAL DEFICIT TARGET
TOPIC: (GS3) ECONOMY: THE HINDU
The Union Budget 2026–27 has set the fiscal deficit target at 4.3% of GDP, down slightly from 4.4% in FY26.
Fiscal deficit
- Fiscal deficit represents the gap between government expenditure and revenue (excluding borrowings).
- India has been following fiscal discipline since the FRBM Act, 2003, which initially set deficit reduction targets.
- The new fiscal rule focuses on the debt-to-GDP ratio, currently at 55.6%, with a target of 50% by 2031.
Budget 2026–27 Highlights
- Fiscal Deficit: Reduced marginally from 4.4% (FY26 RE) to 4.3% (FY27 BE).
- Moderation Explained: Reduction is smaller (10 basis points) compared to FY25–26 (40 basis points), due to a fall in gross tax-to-GDP ratio (11.5% in FY25 → 11.4% in FY26 → 11.2% in FY27).
- Revenue Trends:
- Net tax receipts budgeted at ₹28.7 lakh crore, up 7.2% from FY26 RE.
- Corporate tax revenue projected at ₹12.3 lakh crore (+11%).
- Income tax revenue projected at ₹14.7 lakh crore (+11.7%).
- Expenditure Trends:
- Total expenditure budgeted at ₹53.5 lakh crore (+7.7%).
- Capital expenditure set at ₹12.2 lakh crore (+11.5%), amounting to 4.4% of GDP, the highest in a decade.
Implications
- Fiscal consolidation is moderate, balancing debt reduction with growth needs.
- Focus remains on capital expenditure to drive infrastructure and long-term growth.
- Revenue shortfalls, especially in GST and indirect taxes, limit faster deficit reduction.
Importance of Fiscal Deficit
- Indicator of Fiscal Health – Shows how much the government borrows to meet spending needs.
- Influences Inflation & Interest Rates – High deficits can fuel inflation and raise borrowing costs.
- Investor Confidence – Lower deficits improve credit ratings and attract foreign investment.
History of Fiscal Deficit Targeting in India
- FRBM Act, 2003 – Introduced binding targets for fiscal deficit and revenue deficit.
- Post-2008 Crisis – Targets relaxed to allow stimulus spending.
- Recent Shift – Focus moved from fiscal deficit to debt-to-GDP ratio, with a 50% target by 2031.
Challenges in Fiscal Deficit Management
- Revenue Shortfalls – Tax collections often fall below estimates, forcing expenditure cuts.
- High Subsidy Burden – Food, fuel, and fertilizer subsidies strain fiscal space.
- Balancing Growth & Discipline – Need to invest in welfare and infrastructure while keeping borrowing sustainable.
Conclusion
The fiscal deficit target of 4.3% for FY27 reflects cautious consolidation, balancing debt reduction with growth needs. However, sustained revenue mobilisation and protection of development spending are essential to ensure inclusive and resilient economic progress.
CHANGING ECOLOGY RESEARCH FROM FIELD TO SCREEN
TOPIC: (GS3) ENVIRONMENT: THE HINDU
Ecological research is increasingly shifting from traditional fieldwork to computer-based (in silico) methods using AI, sensors, and big data.
Background
- Traditionally, ecologists relied on direct fieldwork — forests, wetlands, oceans — to observe biodiversity.
- Fieldwork was seen as both a method and identity of ecological science.
- The rise of AI, robotics, and digitisation is redefining how ecological data is collected and analysed.
Drivers of Change
- Explosion of Data: Over a billion natural history specimens digitised globally.
- Citizen Science: Platforms like iNaturalist contribute millions of observations.
- Technology Inputs: Satellites, drones, camera traps, acoustic sensors, and environmental DNA samplers stream continuous data.
- AI Applications: Classifies species, tracks migration, models distributions, and predicts ecological futures.
Screen Ecology – Advantages
- Reduces human disturbance in sensitive habitats.
- Operates in extreme or inaccessible environments (deep oceans, dense forests).
- Generates standardised, high-resolution data across large scales.
- Saves time and resources, allowing faster analysis compared to long-term field studies.
Concerns and Challenges
- Risk of “extinction of experience” – loss of direct engagement with nature.
- Algorithms may carry biases if not grounded in field knowledge.
- Data is not neutral – depends on how and where it is collected.
- Fear of eroding ecological intuition and ethical responsibility.
Shifting Perspectives
- Not every ecologist needs to be a field naturalist; division of labour is becoming essential.
- Human observation is subjective and limited, while robotic systems provide continuous, unbiased monitoring.
- AI can uncover hidden ecological patterns across scales.
- Fieldwork is being redefined: camera traps, sensors, and machine-learning models are now considered legitimate field instruments.
Way Forward
- Balance in silico methods with ecological realities.
- Ensure technology-driven research remains tied to conservation goals and ethical responsibility.
- Recognise that forests and ecosystems still matter, even if scientists study them through data streams rather than physical presence.
OPEN ACREAGE LICENSING POLICY (OALP)
TOPIC: (GS3) ECONOMY: THE HINDU
Oil India has conducted a seismic study of blocks awarded in the ninth round of OALP to prepare its bidding strategy for the upcoming tenth round.
Background
- Introduced on March 30, 2016 under the Hydrocarbon Exploration and Licensing Policy (HELP).
- HELP replaced the New Exploration and Licensing Policy (NELP), which was in place for over 18 years.
- OALP is a major reform that changed how companies apply for oil and gas exploration blocks.
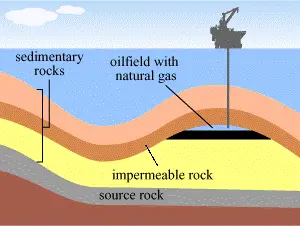
Features of OALP
- Freedom to Choose Areas: Companies can propose exploration in areas not notified by the government.
- Prospecting Rights: Firms can drill after conducting a technical feasibility study showing hydrocarbon potential.
- Approval Process: Exploration requires permission from the Directorate General of Hydrocarbons (DGH).
- Auction System: If multiple firms apply for the same block, DGH conducts an auction for allotment.
- National Data Repository (NDR): Provides access to seismic surveys, geological maps, well logs, and exploration history to help companies identify potential blocks.
- Flexibility: Unlike earlier policies, firms no longer need to wait for government tenders to explore new areas.
Significance
- Encourages private and foreign investment in hydrocarbon exploration.
- Enhances domestic energy security by reducing import dependence.
- Promotes efficient use of seismic data and transparency in block allocation.
- Supports India’s long-term goal of becoming more self-reliant in energy resources.
UNITED NATIONS COMMISSION FOR SOCIAL DEVELOPMENT (CSOCD)
TOPIC: (GS2) INTERNATIONAL RELATIONS: THE HINDU
The Minister of State for Women and Child Development is leading the Indian delegation at the 64th Session of CSocD. The session highlights India’s role in shaping global social development policies.
About CSocD
- A functional commission of ECOSOC (UN Economic and Social Council).
- Established at the inception of the UN; earlier called the Social Commission.
- Advises ECOSOC and member governments on social policy and development issues.
Purpose and Role
- Promotes international cooperation on social development.
- Focus areas:
- Poverty eradication.
- Social inclusion and equity.
- Sustainable and welfare-oriented development.
- Since the 1995 World Summit in Copenhagen, CSocD oversees the Copenhagen Declaration and Programme of Action.
Membership
- Initially 18 members, expanded over time; currently 46 members.
- Members elected by ECOSOC for four-year terms, ensuring geographical balance.
Meetings
- Held annually in February at the UN Headquarters, New York.
- Provides a platform for governments to discuss and frame social development strategies.
Significance
- Acts as the main UN body for social development policy.
- Helps nations align their domestic policies with global social goals.
- Strengthens cooperation on issues like employment, social protection, and inclusion of vulnerable groups.