WHY SOME RIVERS STAY SINGLE WHILE OTHERS SPLIT
TOPIC: (GS1) GEOGRAPHY: THE HINDU
A recent study by geographers at the University of California, Santa Barbara (UCSB), published in science, has identified the mechanism behind why some rivers remain single-threaded while others branch into multiple channels. The research used 36 years of satellite data to explain this long-standing geomorphological puzzle.
Background
- Rivers appear in two main forms: single-thread (meandering) and multi-thread (braided).
- These forms influence flood risks, erosion, ecosystems, and water management.
- In India, rivers like the Ganga and Brahmaputra show different behaviours, often shaped by both natural processes and human interference.
Key Findings of the Study
- Single-thread Rivers: Maintain equilibrium between bank erosion and deposition. Erosion on one side is balanced by accretion on the other, keeping the river stable in width.
- Multi-thread Rivers: Show higher erosion than deposition. Channels widen, split, and form unstable braided patterns. Example: Brahmaputra, highly braided, with fast lateral erosion.
- Role of Human Interference: Dams, embankments, sand mining, and agriculture often convert multi-threaded rivers into single channels. Such artificial confinement increases long-term flood risks.
Additional Insights
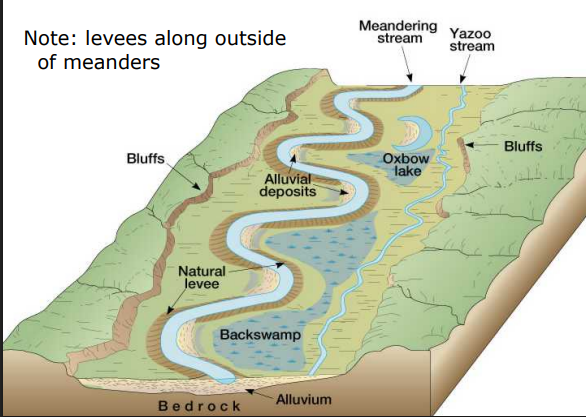
- Vegetation’s Role: Vegetated banks influence river bends differently than unvegetated banks. Vegetation promotes levees, reducing excessive meandering.
- India Case Studies: Ganga (Patna, Farakka, Paksey) and Brahmaputra (Assam, Bangladesh, Himalayas) analysed. Multi-thread rivers in India erode banks faster, creating unstable channels prone to flooding.
Implications for India
- Flood Risk Management: Rating curves for river flows in braided rivers must be updated frequently due to changing shapes.
- River Restoration Solutions: Removing embankments and restoring floodplains. Creating vegetated buffer zones and wetlands. Reconnecting abandoned channels for natural resilience.
- Cost Benefits: Multi-threaded rivers can naturally restore faster, reducing restoration costs if managed properly.
Significance
- The study redefines river management by showing that erosion–deposition imbalance drives braiding, not equilibrium.
- For India, it highlights the urgent need for nature-based solutions in managing rivers like the Ganga and Brahmaputra, which are highly flood-prone.
Shanghai Cooperation Organisation (SCO)
- Formation: Established in 2001 in Shanghai.
- Members: 9 full members – China, Russia, India, Pakistan, Kazakhstan, Kyrgyzstan, Tajikistan, Uzbekistan, and Iran (joined in 2023).
- Headquarters: Beijing, China.
- Official Languages: Chinese and Russian.
- Origin: Evolved from the Shanghai Five (1996) – China, Russia, Kazakhstan, Kyrgyzstan, Tajikistan.
Main Objectives
- Promote peace, security, and stability in the region.
- Strengthen economic cooperation among members.
- Counter terrorism, separatism, and extremism.
Conclusion:
River morphology is not static; it is shaped by erosion, vegetation, and human actions. Understanding these dynamics is crucial for disaster management, ecological restoration, and sustainable water governance in India.
INDIA–U.S. RELATIONSHIP: TRUST BEYOND TARIFFS
TOPIC: (GS2) INTERNATIONAL RELATIONS: THE HINDU
The U.S. has recently doubled tariffs to 50% on several Indian exports such as gems, textiles, and agriculture products, creating concerns about trade losses. However, despite tariff disputes, the India–U.S. partnership remains resilient due to strong strategic, economic, and people-to-people ties.
Impact of U.S. Tariff Hike
- Trade at Risk: Out of India’s $87.3 billion exports to the U.S. (2024), goods worth $48–55 billion may be directly affected.
- Sectors hit the hardest:
- Gems & Jewellery: ~$10 billion annually, U.S. buys over 25% of India’s exports.
- Textiles & Apparel: ~$8 billion, nearly 70% now under higher tariffs.
- Agriculture: ~$6 billion, covering rice, spices, seafood, and niche products.
- Leather & Footwear: ~$3 billion, facing stiff competition from low-cost producers.
- Exporter Response: Surge in July 2025 shipments, with jewellery exports up 16% and lab-grown diamonds up 27.6%, showing both adaptability and anxiety.
Resilient Areas of Trade & Cooperation
Despite tariff hikes, many high-value sectors remain unaffected and continue to grow:
- Pharmaceuticals: India supplies 40% of U.S. generic drug demand; $3.7 billion exports in H1 2025.
- Services & IT: $33.2 billion exports to the U.S. in FY 2024–25; Indian IT firms drive U.S. businesses.
- Energy & Clean Tech: Cooperation in LNG, renewables, and decarbonisation.
- Defence: Technology transfer, co-production, and joint military drills under 2+2 Dialogue.
- Aviation & Aerospace: Boeing aircraft deals, airport modernisation projects.
- Space & Innovation: NASA–ISRO partnerships in lunar missions, satellite navigation, and digital innovation.
People-to-People Connect:
- Diaspora: 4.8 million Indian-origin people in U.S.; ~150 Indian-origin CEOs lead global companies.
- Students: Over 2 lakh Indian students in U.S. universities, building innovation bridges.
- Professionals: Indian IT talent in Silicon Valley and U.S. start-up investments in Bengaluru.
- Cultural Links: Indian festivals celebrated in the U.S., with Indian Americans in political leadership.
Strategic Collaborations Beyond Trade
- Defence & Security: Intelligence sharing, joint exercises, technology collaborations.
- Climate Action: Joint efforts on renewables, hydrogen, and sustainable fuels.
- Healthcare & Pharma: Partnerships in R&D, trials, and vaccine production.
- Space: Expanding cooperation in advanced missions.
Way Forward for India
- Diversify Markets: Explore Africa, Latin America, Indo-Pacific.
- Build Domestic Resilience: Strengthen supply chains and move up the value chain.
- Strategic Diplomacy: Continue dialogue to manage disputes without derailing ties.
- Innovation Push: Focus on clean tech and advanced manufacturing for competitiveness.
Conclusion
While tariff hikes create short-term challenges, India–U.S. ties are defined by trust, strategy, and human connections rather than trade disputes. The partnership has survived Cold War tensions, sanctions, and earlier trade frictions — and each time, it has only grown stronger
DECARBONISATION OF INDIA’S EMISSION-HEAVY SECTORS
TOPIC: (GS3) ENVIRONMENT: INDIAN EXPRESS
A study by the Centre for Social and Economic Progress highlights that India will need around $467 billion by 2030 to decarbonise four major emission-heavy sectors: steel, cement, power, and road transport, to meet climate goals under the Paris Agreement.
Decarbonisation: Meaning
- Definition: Decarbonisation refers to reducing carbon dioxide (CO₂) emissions or equivalent greenhouse gases in key sectors.
- Purpose: Helps meet global temperature targets under the Paris Agreement.
- Method: Transitioning to renewable energy sources like solar, wind, and biomass.
Need for Decarbonisation in India
- High Emissions: Steel, cement, power, and road transport together are the largest contributors to India’s CO₂ emissions.
- Climate Commitments: Essential to achieve Nationally Determined Contributions (NDCs) under the Paris Agreement.
- Public Health: Heavy emissions contribute to air pollution (PM2.5 and NOx), affecting urban health.
- Energy Security: Reduces dependence on fossil fuels, lowering import bills.
- Economic Competitiveness: Global markets are moving towards low-carbon supply chains, requiring India to adapt or risk trade disadvantages.
Challenges
- Environmental: Over 70% of electricity still comes from coal; transitioning to renewables is resource-intensive.
- Technology Gaps: Advanced solutions like green hydrogen, carbon capture and storage (CCS), and battery storage are expensive and underdeveloped.
- Regulatory Fragmentation: Overlapping central and state regulations slow down implementation.
- Financing Needs: $467 billion required by 2030, with steel and cement needing $251B and $141B, mainly for CCS technologies.
- Social Impact: Millions employed in fossil fuel sectors need reskilling and social protection.
Progress Made
- India achieved 50% of installed electricity capacity from non-fossil sources, five years ahead of its 2030 target.
- Initiatives like PM-KUSUM and PM Surya Ghar promoted solar energy among farmers and households.
- Expansion of utility-scale solar parks, wind energy, and bioenergy has created rural employment and improved air quality.
- India is emerging as a global climate leader, advocating equity and sustainable lifestyles.
Way Forward
- Develop sector-specific roadmaps with clear milestones for steel, cement, power, and transport.
- Modernize the electricity grid and promote public-private partnerships to accelerate clean energy adoption.
- Focus on technology-driven and inclusive solutions to achieve 500 GW non-fossil capacity by 2030 and net-zero emissions by 2070.
Conclusion
Decarbonising emission-heavy sectors is essential for India to meet its climate commitments, improve public health, and maintain economic competitiveness. With strong policy support, investment in clean technology, and inclusive strategies, India can achieve sustainable growth while leading global climate action.
RETHINKING CARBON PRICING AND TAXES
TOPIC: (GS3) ENVIRONMENT: THE HINDU
The upcoming U.K. Carbon Border Adjustment Mechanism (UK-CBAM), set to begin in 2027, may erode the benefits of the India-U.K. FTA, as Indian exports of steel and aluminium could face higher costs due to carbon pricing mismatches.
Background
- The India-U.K. Free Trade Agreement reduces tariffs on Indian steel and aluminium exports to zero.
- However, under UK-CBAM, imports must pay the same carbon price as U.K. producers.
- Current U.K. carbon price: $66/tCO₂ → adds 20–40% extra costs for Indian exporters.
- India’s projected carbon price under Carbon Credit Trading Scheme (CCTS): $8–10/tCO₂, creating a large gap.
CBAM:
- CBAM is a carbon tariff or tax imposed on imported goods based on their carbon emissions during production.
- Its goal is to prevent “carbon leakage”, where companies move production to countries with weaker climate policies.
- Ensures that imports face similar carbon costs as domestic products in the importing country.
Key Features
- Covers carbon-intensive products such as steel, aluminum, cement, electricity, and fertilizers.
- Importers must report the embedded emissions in their products and may pay a carbon price.
- Credits or allowances may be given if the exporting country already has a carbon pricing mechanism.
- Intended to incentivize cleaner production in exporting countries.
Key Concerns for India
- Limited Deductions: It is unclear whether U.K. will recognise India’s coal cess, renewable obligations, and other levies as valid deductions.
- Trade Impact: While tariffs go down to 0% under FTA, CBAM will nullify this gain by imposing a high carbon cost.
- Violation of Multilateral Norms: Such unilateral carbon pricing undermines the Paris Agreement principles of “common but differentiated responsibilities.”
- Fragmentation Risk: Different carbon pricing rules across countries → higher compliance costs, trade disruption, carbon leakage.
Global Perspective
- IMF (2021): Suggested an International Carbon Price Floor (ICPF): $25/tCO₂ for low-income nations, $50 for middle-income, $75 for high-income.
- WEF Proposal: Phase-wise harmonisation of carbon pricing. Linking regional markets (EU, China, India, Asia) to reduce fragmentation.
- Multilateral Agencies (2024 report): Warned against fragmented carbon markets as they increase costs and weaken climate goals.
National Action Needed
- Unify Carbon Pricing: Merge coal cess, renewable obligations, and other implicit taxes into a single framework under CCTS.
- Set Explicit Carbon Tax: Improves transparency, price discovery, and global credibility.
- Recycle Revenues: Use carbon tax income for green technology and industrial decarbonisation.
- Climate Finance Taxonomy: Ministry of Finance’s draft framework can attract clean-tech investments.
- Industry Role: Treat low-carbon technologies not just as compliance but as a tool for competitiveness in global trade.
CARBON TRADING:
Carbon trading is a market-based system to reduce greenhouse gas (GHG) emissions. Countries or companies with excess emission allowances can sell them to those exceeding their limits.
- The goal is to incentivize emission reductions while allowing flexibility.
- Also called “emissions trading” or “cap-and-trade” system.
History of Carbon Trading
Early International Framework
- 1992: UN Framework Convention on Climate Change (UNFCCC) adopted at Rio Earth Summit.
- Set the stage for international cooperation on reducing GHGs.
- Introduced the concept of flexible mechanisms for emissions reduction.
Kyoto Protocol (1997)
- First major treaty introducing carbon trading mechanisms.
- Created three market-based mechanisms:
- International Emissions Trading (IET): Countries can trade emission allowances.
- Clean Development Mechanism (CDM): Developed countries can fund projects in developing countries and earn credits.
- Joint Implementation (JI): Two developed countries can collaborate to reduce emissions and share credits.
Post-Kyoto Developments
- European Union Emissions Trading System (EU ETS, 2005):
- First large-scale carbon market in the world.
- Other countries like Japan, Canada, South Korea, and China established national or regional carbon markets.
Paris Agreement (2015)
- Introduced Article 6, enabling international carbon trading under the new global climate framework.
- Encourages countries to cooperate on carbon markets while achieving Nationally Determined Contributions (NDCs).
Conclusion
UK-CBAM highlights the urgent need for India to strengthen its domestic carbon pricing system and work with developing nations for coordinated positions. Proactive national reforms will ensure India remains competitive while preparing to integrate into future global carbon markets.
NOISE POLLUTION IN INDIAN CITIES
TOPIC: (GS3) ENVIRONMENT: THE HINDU
Recent studies and judicial observations highlight that urban noise levels in Indian cities are exceeding safe limits, especially near schools, hospitals, and residential areas, raising concerns about public health, ecology, and governance failures.
Urban Noise Pollution
- Noise pollution is one of the least addressed public health issues in India.
- Cities like Delhi and Bengaluru regularly report noise levels above 65–70 dB(A) near sensitive zones, against WHO’s safe limit of 50 dB(A) during the day and 40 dB(A) at night.
- Unlike air or water pollution, noise is invisible, leading to less public outrage and weak enforcement.
Monitoring and Enforcement Gaps
- The National Ambient Noise Monitoring Network (NANMN) was launched in 2011 to provide real-time data.
- However, monitoring is ineffective: Sensors often placed incorrectly (25–30 feet high, violating CPCB’s 2015 guidelines). Data is scattered and rarely used for enforcement.
- State Pollution Control Boards function in silos; public access to data is limited.
Legal and Constitutional Dimensions
- Noise Pollution (Regulation and Control) Rules, 2000 provide a framework but enforcement is symbolic.
- Supreme Court rulings (2005, reaffirmed in 2024): Excessive noise violates Article 21 (Right to Life with Dignity).
- Article 48A mandates environmental protection, but silence zones (near hospitals, schools) remain the worst affected.
Health and Ecological Impact
- Noise pollution disrupts mental health, sleep, and cardiovascular well-being.
- Children, elderly, and patients with existing illnesses are most vulnerable.
- Ecological damage: A 2025 study showed urban noise disrupts bird songs and sleep cycles, affecting biodiversity and communication systems.
Reasons for Weak Action
- Lack of coordination between traffic police, municipal bodies, and pollution boards.
- Civic fatigue: honking, drilling, and loudspeakers seen as “normal urban sounds.”
- Corruption and administrative neglect reduce accountability.
Needed Reforms
- Decentralise Monitoring: Local bodies should have real-time noise data and enforcement power.
- Link Data to Action: Impose penalties, regulate construction, and enforce zoning rules.
- Awareness Campaigns: Move beyond symbolic “No Honking Days” to sustained behavioural change.
- Urban Planning for Silence: Redesign roads, zones, and construction practices for acoustic resilience.
- National Acoustic Policy: A framework similar to Air Quality Standards, defining decibel limits across zones.
Conclusion
Noise pollution in India is not only an environmental concern but also a constitutional issue linked to dignity and health. Tackling it requires strict enforcement, cultural change, and planning for sonic empathy to make cities livable.
GDP GROWTH AND FISCAL CONCERNS
TOPIC: (GS3) ECONOMY: THE HINDU
India’s GDP growth for Q1 of FY 2024-25 came in at 7.8%, higher than expected. However, doubts remain about sustainability of growth, data reliability, and the government’s ability to meet its fiscal deficit target.
Highlights of GDP Data
- Q1 GDP growth: 7.8%, higher than RBI’s projection of 6.5%.
- Manufacturing sector grew 7.7%, impressive given last year’s high base of 7.6%.
- Services sector remained the main driver of growth, underlining India’s dependency on services.
GDP at Market Prices (GMP)
- The total value of goods and services produced in the economy, including indirect taxes (like GST, excise) and minus subsidies.
- Central Statistics Office (CSO) releases GDP at Market Prices and Factor Cost.
- Gives a picture of the overall economy as reflected in market transactions.
Manufacturing Sector
- Strong GDP growth numbers contrast with ground-level data: Index of Industrial Production (IIP) rose only 3.3%, slower than 4.3% last year. Steel consumption growth fell sharply.
- Passenger vehicle sales down 5.4%, commercial vehicles down 0.6%, two-wheelers down 6.2%, three-wheelers almost flat.
- Freight movement slowed: Rail freight grew 2.5% vs. 5% last year. Air cargo growth fell to 5.4% from 13.9%.
- Suggests domestic demand, not exports, was likely driving production.
Questions on Data Quality
- Nominal GDP growth reported at 8.8%, implying inflation of only 1% in Q1.
- Actual price levels appear higher, raising doubts about accuracy of deflators used in GDP calculations.
- Calls for strengthening statistical systems for reliable economic measurement.
Fiscal Deficit Concerns
- Low nominal GDP growth makes it harder to achieve fiscal deficit targets (since revenues are linked to nominal growth).
- Upcoming GST rate cuts may further reduce revenue.
- Government may face difficulty balancing spending commitments with reduced income.
Government Outlook
- Chief Economic Adviser stated GDP growth for FY 2024-25 will remain within 6.3–6.8%.
- This implies a slowdown in coming quarters, despite current high growth.
NOMINAL GDP GROWTH
- Definition: Growth of GDP measured at current market prices, without adjusting for inflation.
- Includes: Both production increase and price level changes.
- Use: Shows the total economic value in current currency terms.
Example:
- Suppose India produced goods worth ₹100 lakh in 2024.
- In 2025, production remains the same, but prices rise by 10%.
- Nominal GDP in 2025 = ₹110 lakh
- Nominal GDP growth = 10% (includes inflation)
Key Point: Nominal GDP can rise even if actual output hasn’t increased, just due to price rise.
REAL GDP GROWTH
- Definition: Growth of GDP measured at constant prices, adjusted for inflation.
- Excludes: Effect of price changes; reflects true increase in production/output.
- Use: Shows actual economic growth in terms of goods and services produced.
Example:
- Using the above scenario, if prices increased by 10% but actual production stayed the same,
- Real GDP growth = 0% (no real increase in production)
Why GDP Growth Rate is Important for India
- Economic Performance Indicator: Measures how fast the economy is expanding; helps assess development, production, and income trends.
- Policy Formulation: Guides government and RBI in fiscal and monetary decisions, including spending, taxation, and interest rates.
- Investment & Business Confidence: High growth attracts domestic and foreign investment, boosts employment and industrial activity.
Deficiencies of GDP Growth Rate
- Does Not Reflect Inequality: GDP growth may rise while income distribution remains skewed; does not indicate poverty reduction.
- Ignores Informal Economy: A large part of India’s economy (agriculture, small businesses) is informal and may be underrepresented in GDP.
- Neglects Environmental and Social Costs: Growth may come at the cost of pollution, resource depletion, and social well-being, which GDP does not capture.
Way Forward
- Incorporate Inclusive Indicators: Complement GDP with metrics like Human Development Index (HDI), Gini coefficient, and employment data.
- Improve Data Coverage: Strengthen surveys and statistical methods to include informal and rural sectors accurately.
- Sustainable Growth Focus: Include environmental accounting and green GDP measures to ensure growth is long-term and socially responsible.
Conclusion
India’s Q1 GDP data has created optimism, but deeper analysis shows inconsistencies in manufacturing, weak consumption signals, and fiscal challenges. Sustainable growth will require robust data systems, stronger demand, and fiscal prudence.
THE RISE AND RISKS OF HEALTH INSURANCE IN INDIA
TOPIC: (GS2) SOCIAL JUSTICE: THE HINDU
India has been rapidly expanding health insurance schemes like PMJAY and State Health Insurance Programmes, raising concerns about their effectiveness in achieving Universal Health Coverage (UHC) and their growing risks for the healthcare system.
Universal Health Care (UHC)
- UHC means quality health care for all citizens irrespective of ability to pay.
- India aimed for this since the Bhore Committee (1946), but progress has been limited.
- Many countries, both rich and poor, have achieved UHC, while India continues to struggle.
Growth of Health Insurance in India
- PM Jan Arogya Yojana (PMJAY) launched in 2018 under Ayushman Bharat provides up to ₹5 lakh per household annually.
- Most States have their own health insurance programmes (SHIPs), usually following PMJAY’s model.
- Coverage (2023–24):
- PMJAY: 58.8 crore individuals with ₹12,000 crore budget.
- SHIPs: Similar coverage, about ₹16,000 crore budget.
- Total expenditure: Around ₹28,000 crore, growing rapidly (8–25% annually in some States).
Key Concerns and Faultlines
Promotion of For-Profit Medicine
- Nearly two-thirds of PMJAY funds go to private hospitals, many profit-driven and poorly regulated.
- Instead of correcting inequalities, insurance strengthens private dominance in health care.
Neglect of Primary and Preventive Care
- Insurance focuses on hospitalisation only.
- Outpatient and primary care remain underfunded, increasing long-term health and financial burden.
- Ageing population risks pushing spending heavily into costly tertiary care.
Low Utilisation Despite High Coverage
- Although 80% population is “covered,” many do not know how to access benefits.
- Only about 35% of insured patients could actually use insurance in 2022–23.
- Utilisation gaps are higher among weaker sections.
Discrimination Between Patients
- Private hospitals: Prefer uninsured patients who pay higher charges.
- Public hospitals: Prefer insured patients for reimbursement money.
- Leads to unequal treatment and on-the-spot pressure to enrol in insurance.
Complaints from Hospitals
- Delays in reimbursements; over ₹12,000 crore dues pending under PMJAY.
- 609 hospitals have withdrawn from the scheme since launch.
Corruption and Misuse
- NHA flagged 3,200 hospitals for fraud under PMJAY.
- Issues include denial of treatment, overcharging, or unnecessary medical procedures.
- Lack of effective audits and transparency worsens risks.
Root Problem – Underinvestment in Public Health
- Public health spending in India is just 1.3% of GDP (2022), compared to global average of 6.1%.
- UHC cannot be achieved without strengthening public health facilities.
- Insurance acts like a “painkiller” — it provides temporary relief but does not fix the structural weaknesses.
Way Forward
- Increase public investment in healthcare infrastructure.
- Focus on primary care and prevention rather than only hospitalisation.
- Ensure strict regulation and accountability of private providers.
- Learn from global models (e.g., Thailand, Canada) where non-profit providers and universal systems are prioritised.
Conclusion
Expanding health insurance without addressing the fundamental weaknesses of India’s public health system risks making healthcare more profit-driven and unequal. Real UHC requires investment, regulation, and strong public institutions rather than just insurance coverage.
BRAIN-EATING AMOEBA INFECTIONS IN KERALA
TOPIC: (GS2) HEALTH: THE HINDU
Kerala has reported three deaths this year due to amoebic meningoencephalitis, caused by the “brain-eating amoeba.” So far, 42 cases have been detected in the State, with the infection mainly linked to contaminated water.
About the Disease
- The infection is caused by free-living amoeba that enters the body through the nose while swimming, bathing, or using contaminated water.
- Once inside, it reaches the brain and causes severe inflammation.
- The disease is rare but extremely fatal, with a mortality rate of around 95%.
Variants of the Infection
- Primary Amoebic Meningoencephalitis (PAM): Rapidly progressing and commonly reported worldwide.
- Granulomatous Amoebic Encephalitis (GAE): Slower form of infection; this is the variant reported in Kerala.
Symptoms
- Appear within 5–10 days of exposure.
- Common signs include: Fever, Severe headache, Nausea and vomiting, Neurological complications as the infection worsens
Situation in Kerala
- Deaths reported: 3 (including a nine-year-old girl and a 52-year-old woman).
- Total cases: 42 recorded so far this year.
- Active cases: 13 under treatment, of which 8 are admitted in Kozhikode Medical College Hospital.
Government Response
- Kerala Health Department has started a statewide water chlorination drive to disinfect ponds, tanks, and other waterbodies.
- Awareness campaigns are being promoted to avoid risky dips in unsafe water sources.
- Emphasis on early medical attention for those showing symptoms after exposure to water.
Conclusion
The outbreak highlights the urgent need for safe water management and public awareness. Though rare, amoebic meningoencephalitis is almost always fatal, making preventive measures the most effective approach.