UNRELIABLE AIR AND NOISE DATA
TOPIC: (GS3) ENVIRONMENT: THE HINDU
Recent reports have exposed serious flaws in India’s real-time environmental monitoring systems, including Delhi’s Air Quality Network and Lucknow’s Noise Monitoring Network.
Background
- India’s cities, especially Delhi, are among the most polluted globally.
- Despite high pollution levels, official data often reports “moderate” air quality due to poor sensor placement and data manipulation.
- Similar credibility issues exist in noise pollution monitoring, especially in Lucknow.
- This raises a critical question: Can environmental policies be effective when their data foundations are weak?
Issues with Air Pollution Monitoring
- Faulty Sensor Placement: Many air-quality sensors are installed under trees, near walls, or in less polluted areas, giving artificially low readings.
- Data Misrepresentation: Air Quality Index (AQI) often reports misleadingly good air, despite visible smog and health complaints.
- Governance Lapses: Political interference and lack of independent oversight compromise scientific credibility.
- Impact: Misleading data delays judicial and administrative actions on pollution control.
Issues with Noise Pollution Monitoring
- Weak Network: The National Ambient Noise Monitoring Network in cities like Lucknow fails to capture real decibel levels.
- Outdated Rules: India still follows Noise Pollution (Regulation and Control) Rules, 2000, which are outdated and below WHO standards.
- Enforcement Gaps: Poor implementation and negligible penalties make compliance weak.
- Rights Impact: Inaccurate noise data undermines citizens’ right to health and life (Articles 19 & 21).
Governance and Accountability Concerns
- CPCB Guidelines exist for calibration and sensor placement, but are poorly enforced.
- There is no independent audit mechanism like in many developed nations.
- Public funds are used to install high-end monitoring systems, but without scientific transparency.
- Weak data affects India’s global commitments under the Paris Agreement and WHO air quality standards.
Health and Environmental Impact
- According to the Air Quality Life Index (AQLI), Delhi residents could live 8.2 years longer if air met WHO standards.
- Nationally, air pollution reduces life expectancy by nearly five years.
- Pollutants like PM2.5 and NO₂ are linked to asthma, reduced lung function, and myopia.
- Faulty data conceals these threats, leaving vulnerable groups—children, elderly, and patients—at greater risk.
Science-Driven Monitoring
- Ensure Sensor Accuracy: Install devices strictly following CPCB standards.
- Independent Oversight: Establish third-party audits and expert review panels.
- Open Data Access: Make real-time, raw data publicly available for scrutiny.
- Citizen Involvement: Encourage community monitoring and transparency mechanisms.
- Policy Integrity: Treat environmental monitoring as a scientific foundation, not a bureaucratic display.
Indian Initiatives for Pollution Detection In Cities
Continuous Ambient Air Quality Monitoring Stations (CAAQMS)
- Nodal Agency: Central Pollution Control Board (CPCB) under the Ministry of Environment, Forest and Climate Change (MoEFCC).
- What it does: Provides real-time air quality data across major Indian cities.
- Pollutants measured:
- Particulate Matter — PM₂.₅, PM₁₀
- Gaseous pollutants — SO₂ (Sulphur Dioxide), NO₂ (Nitrogen Dioxide), CO (Carbon Monoxide), O₃ (Ozone), NH₃ (Ammonia), Pb (Lead) and Benzene, Toluene, Xylene (BTX).
National Clean Air Programme (NCAP)
- Launched: 2019 by MoEFCC.
- Purpose: To reduce PM₂.₅ and PM₁₀ levels by 20–30% by 2024 (baseline 2017).
- How it works: Expands monitoring networks, installs new air sensors, and integrates data from CAAQMS and local bodies.
- Pollutants tracked: PM₂.₅, PM₁₀, NO₂, SO₂, CO, O₃, and Volatile Organic Compounds (VOCs).
SAFAR (System of Air Quality and Weather Forecasting and Research)
- Developed by: Indian Institute of Tropical Meteorology (IITM), Pune — under the Ministry of Earth Sciences.
- Coverage: Major cities such as Delhi, Pune, Ahmedabad, and Mumbai.
- Function: Provides 24-hour air quality forecasts and health advisories.
- Pollutants measured: PM₂.₅, PM₁₀, NO₂, SO₂, CO, O₃, and Black Carbon (BC).
Conclusion
India’s environmental governance must rest on scientific integrity, transparency, and accountability.
Without credible data, real-time monitoring becomes real-time deception, and the true cost is borne by citizens—through disease, shorter lifespans, and loss of trust in institutions.
This article has been updated and published in detail on our new platform. Please visit the link below for the latest version:
INDIA’S TRAVAILS IN NEGOTIATING A FRIENDLESS WORLD
TOPIC: (GS2) INTERNATIONAL RELATIONS: THE HINDU
A former National Security Adviser, M.K. Narayanan, highlights that India’s foreign policy is struggling to adapt to a fast-changing, uncertain global order where traditional alliances are weakening and new regional equations are emerging.
Background
- Global politics is witnessing a breakdown of multilateral systems, particularly since the Trump era in the U.S.
- India’s foreign policy, still influenced by Cold War-era thinking, is facing difficulty in keeping pace with modern power shifts.
- The result is India’s growing isolation and trust deficit in both its neighbourhood and the wider world.
India’s Diminishing Geopolitical Relevance
- Reduced Presence in West Asia: India was absent from recent Gaza peace negotiations, where countries like Türkiye, Egypt, and Qatar played key roles.
- Despite India’s long-standing ties with the region, its exclusion signals waning diplomatic influence. Sending a low-level delegation to the post-conflict celebration further underlined this marginalisation.
- Neglect in Neighbourhood Diplomacy: India remained a bystander during Nepal’s Gen Z revolution, showing declining influence even in South Asia.
- Growing Role of Rival Nations: Türkiye and Pakistan’s closer defence ties and Saudi Arabia–Pakistan Strategic Mutual Defence Pact indicate a shift in regional alignments unfavourable to India.
Challenges in the Neighbourhood
- Pakistan-Afghanistan Volatility: The Taliban’s attacks on Pakistan may appear beneficial, but instability in the region poses long-term threats to India’s security.
- Strained Ties with South Asian Neighbours: Relations with Bangladesh and Nepal have cooled, while China’s growing presence in Sri Lanka adds pressure on India’s southern flank.
China Factor
- India’s current “bromance” diplomacy with China risks ignoring unresolved border tensions, including the Galwan clash (2020).
- China’s strategic expansion in East and Southeast Asia — through economic, cyber, and academic influence — threatens to undercut India’s regional standing.
- The U.S.-China trade rivalry is shaping new alignments; India must avoid strategic complacency amid these shifts.
Way Forward
- India must modernise its foreign policy outlook, moving beyond outdated frameworks.
- Strengthen regional partnerships and rebuild credibility through consistent diplomacy.
- Exercise strategic vigilance to safeguard India’s civilisational identity and autonomy in a transforming global order.
Conclusion:
India’s foreign policy faces a crisis of relevance amid shifting alliances, rising Chinese influence, and unstable neighbourhoods. To remain geopolitically significant, India must act with greater flexibility, foresight, and realism in a world where old friends are fading and new power equations are emerging.
This article has been updated and published in detail on our new platform. Please visit the link below for the latest version:
DOES INDIA’S FERTILITY RATE REFLECT REALITY?
TOPIC: (GS3) ECONOMY: THE HINDU
The United Nations Population Fund’s (UNFPA) State of World Population 2025 Report has placed India’s Total Fertility Rate (TFR) at 1.9, which is below the replacement level of 2.1. This has sparked debate over country’s economic and demographic future.
Total Fertility Rate (TFR)
- TFR is a statistical estimate showing the average number of children a woman is likely to have if current age-specific fertility trends continue throughout her reproductive years (15–49 years).
- How it is Calculated:
- The reproductive age is divided into seven five-year age groups (15–19, 20–24 … 45–49).
- The Age-Specific Fertility Rate (ASFR) — number of births per 1,000 women in each group — is calculated.
- These are then converted into per-woman rates and summed to give the TFR.
- Synthetic Cohort Assumption: It assumes that young women today will have fertility patterns similar to today’s older women — a major simplification that often fails to reflect reality.
Limitations in India’s TFR Calculation
- Unrealistic Assumptions: Fertility preferences change over time, especially as women’s education and employment levels rise.
- Tempo Effect: When women postpone births, the TFR temporarily falls even if they eventually have the same number of children.
- Urban–Rural Divide: In cities, fertility is being delayed to later age groups (25–34 years). In villages, births are shifting from teenage mothers to slightly older women, but older age groups show a genuine decline.
- Exclusion of Certain Births: The TFR ignores births to women below 15 or above 49, though early pregnancies still occur in parts of India. Social taboos and underreporting lead to data gaps.
Implications for Policy
- A low TFR does not automatically threaten economic growth — developed regions like Europe and East Asia have thrived with similar rates.
- India has not fully utilised its demographic dividend due to high youth unemployment and skill mismatches.
- Ageing is an emerging issue, but today’s elderly population is not caused by current fertility decline.
- Instead of trying to raise fertility, India should focus on healthcare, social security, and female empowerment to ensure balanced development.
Conclusion
India’s reported TFR of 1.9 may not fully reflect real fertility behaviour due to data and methodological limitations. Policymakers must interpret these figures cautiously, focusing on improving employment, healthcare, and social systems rather than simply targeting population numbers.
This article has been updated and published in detail on our new platform. Please visit the link below for the latest version:
ARSENIC TOXICITY IN RICE CULTIVATION
TOPIC: (GS3) SCIENCE AND TECHNOLOGY: THE HINDU
A new study has shown that the type of microorganisms present in rice fields plays a key role in determining how much arsenic accumulates in rice grains.
Arsenic Toxicity in Agriculture
- Arsenic (As) is a toxic heavy metal and a known carcinogen, found naturally in groundwater and soils of rice-growing regions.
- Rice plants absorb arsenic more easily than other crops, especially in flooded paddy fields, where oxygen is limited.
- Arsenic toxicity leads to health risks in humans and serious yield losses in agriculture.
Mechanism in Flooded Paddy Fields
- In anaerobic (oxygen-poor) conditions, certain microbes transform inorganic arsenic into soluble and bioavailable forms, which are easily taken up by rice roots.
- These toxic organic compounds include dimethylarsinic acid (DMA) and dimethylated monothioarsenate (DMMTA).
- They cause “straighthead disease”, resulting in sterile, upright panicles and up to 70% yield loss.
Soil Microbes and Arsenic Behaviour
- Research by Nanjing Agricultural University (2025) revealed that soil age controls the type of microbial community present:
- Young Soils (<700 years): Dominated by arsenic-methylating bacteria that increase toxicity by forming DMA and DMMTA.
- Old Soils (>700 years): Rich in demethylating archaea that detoxify arsenic by breaking down harmful compounds.
- A global survey of 801 paddy soils found 11 methylators and 6 demethylators influencing arsenic levels.
- Toxicity Risk: When the ratio of methylators to demethylators exceeds 1.5, the chance of straighthead disease rises sharply.
Hotspot Regions in South Asia
- High arsenic contamination reported in West Bengal, Bihar, and Bangladesh, due to irrigation with arsenic-rich groundwater.
Mitigation Measures
- Mid-season drainage: Introduces oxygen to limit arsenic solubility.
- Silicon fertilization: Competes with arsenic uptake in rice roots.
- Microbial management: Promoting demethylating microbes restores soil redox balance and reduces arsenic accumulation.
This article has been updated and published in detail on our new platform. Please visit the link below for the latest version:
RANGARAJAN POVERTY LINE
TOPIC: (GS3) ECONOMY: THE HINDU
Economists from the Reserve Bank of India (RBI) have recently updated India’s poverty estimates using the Household Consumption Expenditure Survey (HCES) 2022–23, applying the Rangarajan Committee (2014) framework — India’s last official benchmark for poverty measurement.
This update provides a fresh picture of poverty reduction and inequality across Indian states.
C. Rangarajan Committee on Poverty Estimation
- Constitution: Formed in 2012 by the Planning Commission, chaired by Dr. C. Rangarajan, former Governor of the RBI.
- Purpose: To create a more comprehensive and realistic measure of poverty that included basic needs beyond just food.
- Report Submitted: June 2014, marking a shift from calorie-based to expenditure-based poverty assessment.
Key Features of the Rangarajan Committee Approach
- Broader Definition of Poverty:
- Included expenses on food, clothing, housing, education, and healthcare.
- Moved beyond the earlier calorie-intake method used by the Tendulkar Committee (2009).
- Poverty Line (2011–12):
- Rural: ₹972 per person per month (~₹32/day)
- Urban: ₹1,407 per person per month (~₹47/day)
- Methodology:
- Based on Monthly Per Capita Expenditure (MPCE) using Modified Mixed Reference Period (MMRP) data.
- Created separate consumption baskets for rural and urban areas.
- Adjusted for state-wise price variations.
- Findings (2011–12):
- 29.5% of India’s population lived below the poverty line.
RBI’s 2025 Update (DEPR Study)
- RBI’s Department of Economic & Policy Research (DEPR) used new HCES 2022–23 data covering 20 states.
- Continued the Rangarajan methodology with updated price and consumption data.
- New Index: Developed a Poverty Line Basket (PLB) Index, considered more accurate than the Consumer Price Index (CPI).
- Food Share in PLB:
- Rural: 57% (vs 54% in CPI)
- Urban: 47% (vs 36% in CPI)
Major Findings (RBI Study)
- Sharp Poverty Reduction:
- Rural Odisha: 47.8% → 8.6%
- Urban Bihar: 50.8% → 9.1%
- Lowest Poverty: Himachal Pradesh (0.4% rural), Tamil Nadu (1.9% urban)
- Highest Poverty: Chhattisgarh (25.1% rural, 13.3% urban)
Significance
- Confirms a broad-based fall in poverty across most Indian states.
- Highlights persistent regional disparities requiring targeted welfare policies.
- Strengthens the argument for a new official poverty line reflecting modern consumption patterns and updated living costs.
This article has been updated and published in detail on our new platform. Please visit the link below for the latest version:
TRANSIENT LUNAR PHENOMENA (TLPS)
TOPIC: (GS3) SCIENCE AND TECHNOLOGY: THE HINDU
Astronomers have once again reported mysterious, short-duration lights and glows appearing on the Moon’s surface. These events — called Transient Lunar Phenomena (TLPs).
What are Transient Lunar Phenomena (TLPs)?
- Short-lived bright flashes, glows, or hazy patches seen on the Moon’s surface, lasting from a few seconds to several hours.
- History: Recorded for over a thousand years — even the Apollo 11 astronauts (1969) observed a glowing area on the Moon.
- Appearance: Can look like reddish glows, spark-like flashes, or misty clouds.

Where They Occur Most Often
- Concentrated mainly around Aristarchus Crater and Plato Crater, known as the Moon’s most geologically active regions.
Possible Causes of TLPs
- Lunar Gas Emissions (Outgassing): Release of trapped gases like radon and argon through surface cracks. Triggered by tidal stress or solar heating, making surrounding dust or gas glow.
- Meteoroid Impacts: Frequent strikes of small meteoroids cause brief but intense light flashes on the lunar surface.
- Electrostatic Dust Activity: Charged lunar dust particles lifted by solar radiation can scatter sunlight, creating short luminous effects.
- Optical Illusions from Earth: Some sightings may actually be due to atmospheric turbulence or refraction, not lunar activity.
Recent Studies and Observations
- Monitoring Tools: Automated telescopes and CCD cameras track lunar flashes in real time.
- Space Missions: NASA’s Lunar Reconnaissance Orbiter (LRO) and Chandrayaan missions record new craters and gas emissions.
- Spectroscopic Findings: Detection of radon gas near Aristarchus Plateau supports the outgassing theory.
- Global Research Efforts: Integrated studies combining optical, seismic, and spectrometric data to verify true TLP events.
Scientific Importance
- Provides clues about ongoing internal processes on the Moon.
- Suggests the Moon is not completely geologically dead, offering insights into its evolution and surface dynamics.
This article has been updated and published in detail on our new platform. Please visit the link below for the latest version:
RAKCHHAM-CHITKUL WILDLIFE SANCTUARY
TOPIC: (GS3) ENVIRONMENT: THE HINDU
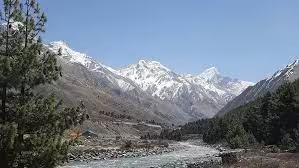
An international bird-watching event was recently held in the picturesque Rakchham region of the Rakchham-Chitkul Wildlife Sanctuary in Himachal Pradesh to promote eco-tourism and biodiversity awareness.

About the Sanctuary
- Location: Situated in Kinnaur district, Himachal Pradesh.
- Area Covered: Spans nearly 31 sq. km.
- Altitude Range: Lies between 3,200 to 5,486 metres above sea level.
- Mountain System: Forms part of the Western Himalayan range.
- Geography: The sanctuary is surrounded by snow-clad peaks, lush valleys, and fast-flowing rivers, creating a pristine natural landscape.
Unique Features
- Dry Climatic Zone: Unlike many other sanctuaries in Himachal Pradesh, it lies in a rain-shadow region and does not experience monsoon rains.
- Trekking Routes: The challenging Lamkhanga Pass trek passes through the sanctuary. This route connects Kinnaur (Himachal Pradesh) with the Gangotri region of Uttarakhand, offering adventure and scenic beauty.
Flora
- Vegetation mainly consists of rhododendron shrubs, oak, and pine forests.
- The region also supports rare medicinal herbs used in traditional Himalayan medicine.
Fauna
- The sanctuary shelters a variety of Himalayan wildlife, including:
- Snow Leopard – apex predator of the high-altitude ecosystem.
- Himalayan Black Bear
- Musk Deer
- Blue Sheep (Bharal)
- Several high-altitude bird species, making it a hub for ornithologists.
Conservation Significance
- Serves as a critical habitat for endangered Himalayan species and promotes eco-tourism through sustainable activities like bird-watching and trekking.
- Helps protect high-altitude biodiversity and local ecosystems vital to the Western Himalayas.
This article has been updated and published in detail on our new platform. Please visit the link below for the latest version:
BATHOU RELIGION
TOPIC: (GS1) SOCIETY: THE HINDU
The Bathou religion, the traditional faith of the Bodo community in Assam, has been granted a separate code in the upcoming Census, recognizing it as a distinct religion for the first time.
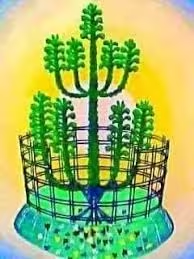
About Bathouism
- Bathouism is the indigenous faith of the Bodo people, who are the largest plains tribal group of Assam.
- The term Bathou comes from the Bodo words Ba (five) and Thou (deep thought), symbolizing the five basic elements of nature.
Core Beliefs and Practices
- The religion is rooted in nature worship and emphasizes harmony with the environment.
- The five elements — Bar (Air), San (Sun), Ha (Earth), Or (Fire), and Okhrang (Sky) — form the foundation of Bathou philosophy.
- The supreme deity is Bwrai Bathou, representing wisdom and power.
- The Sijou plant (Euphorbia splendens) serves as the sacred symbol of Bathouism and is planted in every household altar.
- The altar is fenced with eighteen bamboo pairs and five bamboo bindings, representing the five stages of life—birth, marriage, sorrow, happiness, and death.
This article has been updated and published in detail on our new platform. Please visit the link below for the latest version:
