Table of Contents
ToggleNational Air Quality Index (AQI) in India: Pollutants, Categories, and Governance
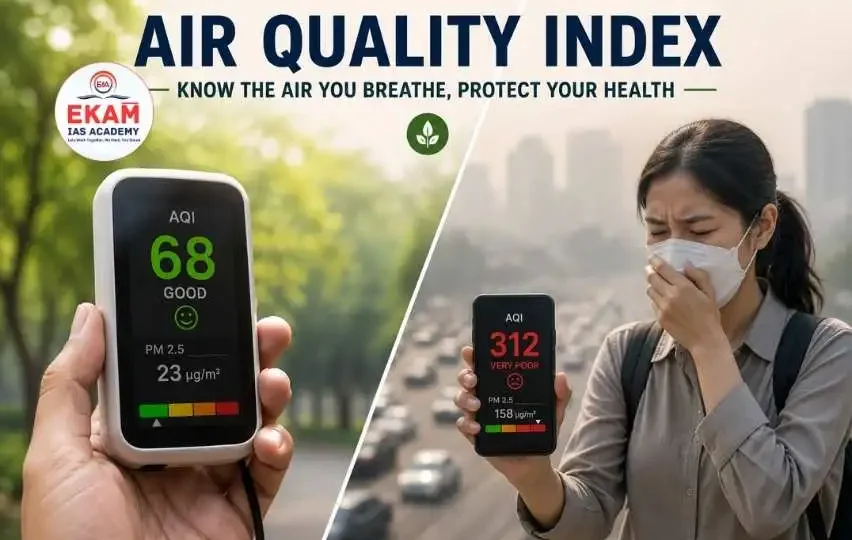
The National Air Quality Index (AQI) serves as the primary tool driving air quality management in India, transforming complex pollution metrics into actionable data for better environmental governance.
Background, Evolution, and Institutional Framework
Historically, ambient air monitoring data in India was published using highly technical scientific values like micrograms per cubic meter (μ g / m³), which the general public found difficult to interpret.
To bridge this communication gap, the Government of India launched the National Air Quality Index on September 17, 2014, under the slogan “One Number, One Color, One Description.”
The program functions under an integrated regulatory architecture:
- The Blueprint: It was developed by a specialist committee composed of leading medical professionals, environmental scientists, and academic experts from IIT Kanpur.
- The Execution: The CPCB AQI monitoring network is maintained by the Central Pollution Control Board (CPCB) in coordination with State Pollution Control Boards (SPCBs).
- The Infrastructure: Data is captured continuously across urban areas using the automated AQI monitoring system via Continuous Ambient Air Quality Monitoring Stations (CAAQMS).
Components of the Air Quality Index India
A critical distinction tested frequently in civil services preliminary exams is the exact combination of gases tracked by this framework. The system monitors eight core pollutants that have direct impacts on public health:
| S.No. | AQI Pollutant |
|---|---|
| 1 | Particulate Matter 10 (PM10) |
| 2 | Particulate Matter 2.5 (PM2.5) |
| 3 | Nitrogen Dioxide (NO2) |
| 4 | Sulfur Dioxide (SO2) |
| 5 | Carbon Monoxide (CO) |
| 6 | Ozone (O3) |
| 7 | Ammonia (NH3) |
| 8 | Lead (Pb) |
AQI Categories and Classification
To help the public understand the data at a glance, the index translates pollutant concentrations into a simple scale from 0 to 500. This scale is divided into six distinct AQI categories, each tied to a specific color code and health warning:
| AQI Range | AQI Categories | Associated Color Code | Health Impacts and Warnings |
| 0 – 50 | Minimal | Green | Minimal health impact; safe for outdoor activities. |
| 51 – 100 | Satisfactory | Light Green | May cause minor breathing discomfort in sensitive individuals. |
| 101 – 200 | Moderate | Yellow | May cause breathing discomfort in people with lung or heart diseases. |
| 201 – 300 | Poor | Orange | May cause breathing discomfort on prolonged exposure to most healthy people. |
| 301 – 400 | Very Poor | Respiratory illness on prolonged exposure; significant risk for vulnerable groups. | |
| 401 – 500 | Severe | Red | Affects healthy people and seriously impacts those with existing diseases. |
Calculation Methodology and Government Initiatives
The AQI monitoring system uses a sub-index system based on a “worst-of” approach. First, separate sub-indices are calculated for each of the eight pollutants based on their average concentrations (using 24-hour averages for most gases, and an 8-hour average for Carbon Monoxide and Ozone).
The overall index value for that day is determined by the single pollutant that records the worst or highest sub-index value, which is then called the “dominant pollutant.”
Strategic Air Pollution Control Measures:
The data generated by the index directly triggers several national environmental interventions:
- National Clean Air Programme (NCAP): Uses AQI data to drive targeted pollution-reduction plans in over 130 non-attainment cities across India.
- Graded Response Action Plan (GRAP): An emergency enforcement framework in the Delhi-NCR region that automatically triggers strict regulations—such as bans on construction work, entry limits on commercial trucks, and school closures—whenever the index crosses into “Very Poor” or “Severe” thresholds.
Challenges
The effectiveness of our current tracking framework faces certain technical and systemic hurdles. Rural areas often lack sufficient continuous monitoring stations, which skews our national data toward urban industrial centers. Additionally, while the index tracks pollutant concentrations effectively, it does not analyze chemical composition variations, such as identifying heavy metal particles within PM2.5 fractions.
Way Forward
To improve air quality management in India, the government must expand its monitoring network into rural and semi-urban areas to create a more comprehensive national database. Integrating satellite-derived aerosol data with ground station metrics will provide better regional coverage.
By linking real-time emissions data from factories directly to enforcement actions, ensuring strict multi-sector compliance, and running public awareness campaigns, India can use this tracking index as an effective tool for pollution control and public health protection.
Conclusion
The National Air Quality Index represents a vital step forward in modernizing India’s approach to environmental health. By transforming complex chemical data into a simple, color-coded health guide, the index empowers citizens to make informed daily decisions while holding municipal authorities accountable. As India works to expand its industrial base and urban centers, using automated, transparent data systems like the AQI will be essential to ensure sustainable development and clean, breathable air for all.
UPSC Prelims: PYQs & Practice Questions
Previous Year Questions (Prelims)
UPSC CSE Prelims 2016
Q: In the context of solving pollution problems, what is/are the advantage/advantages of bioremediation technique?
1. It is a technique for cleaning up pollution by enhancing the same biodegradation process that occurs in nature.
2. Any contaminant with heavy metals such as cadmium and lead can be readily and completely treated by bioremediation using microorganisms.
3. Genetic engineering can be used to create microorganisms specifically designed for bioremediation.
Select the correct answer using the code given below:
(a) 1 only
(b) 2 and 3 only
(c) 1 and 3 only
(d) 1, 2 and 3
Answer: (c) 1 and 3 only
Explanation:
Statement 1 is correct because bioremediation uses natural biodegradation processes to clean up pollution. Statement 3 is also correct because genetic engineering can be used to develop microorganisms for specific bioremediation purposes. Statement 2 is incorrect because heavy metals such as cadmium and lead cannot be readily and completely biodegraded by microorganisms; they can only be stabilized, immobilized, or accumulated.
UPSC CSE Prelims 2015
Q: In the cities of our country, which among the following atmospheric gases are normally considered in calculating the value of Air Quality Index (AQI)?
1. Carbon dioxide (CO2)
2. Carbon monoxide (CO)
3. Nitrogen dioxide (NO2)
4. Sulfur dioxide (SO2)
5. Methane (CH4)
Select the correct answer using the code given below:
(a) 1, 2 and 3 only
(b) 2, 3 and 4 only
(c) 1, 4 and 5 only
(d) 1, 2, 3, 4 and 5
Answer: (b) 2, 3 and 4 only
Explanation:
The CPCB Air Quality Index tracks eight major pollutants: PM10, PM2.5, NO2, SO2, CO, O3, NH3, and Pb. It excludes major greenhouse gases like carbon dioxide (CO2) and methane (CH4). Therefore, removing statements 1 and 5 gives option (b).
Practice Questions
Q: Consider the following statements regarding the application of Air Pollution Control Measures in India:
1. The Graded Response Action Plan (GRAP) is an emergency pollution-control mechanism automatically triggered nationwide based on average values from the National Clean Air Programme.
2. The National AQI uses a "worst-of" logic, where the daily overall index value corresponds exactly to the sub-index of the single worst dominant pollutant.
Which of the statements given above is/are correct?
(a) 1 only
(b) 2 only
(c) Both 1 and 2
(d) Neither 1 nor 2
Answer: (b) 2 only
Explanation:
Statement 1 is incorrect because GRAP is not a nationwide mechanism. It is a localized, step-by-step emergency framework developed specifically for the Delhi-NCR region to manage winter smog crises. Statement 2 is correct because the AQI operates on a sub-index system where the final number is determined by whichever pollutant records the highest or worst sub-index value on that day.
Q: Which of the following color codes is accurately matched with its corresponding AQI category and range according to CPCB guidelines?
(a) 0–50 : Satisfactory — Light Green
(b) 101–200 : Moderate — Yellow
(c) 301–400 : Severe — Red
(d) 401–500 : Very Poor — Purple
Answer: (b) 101–200 : Moderate — Yellow
Explanation:
According to the CPCB AQI categories, 0–50 is Good and shown in Green. 101–200 is Moderate and shown in Yellow, making option (b) correct. 301–400 is categorized as Very Poor, while 401–500 is categorized as Severe.
UPSC Mains – Previous Year & Practice Questions
Mains Previous Year Questions
Mains 2023
Question: Describe the severe effects of vehicular emissions on human health in metropolitan cities. What measures have been introduced to control this hazard?
Requires mapping how AQI indices help quantify vehicular pollution impacts.
Mains 2021
Question: Describe the key features of the National Clean Air Programme (NCAP) launched by the Government of India.
Directly tests how AQI values identify non-attainment cities.
Mains 2018
Question: What are the key drivers of the toxic winter smog in the Indo-Gangetic plains? Discuss the effectiveness of legal frameworks in curbing agricultural residue burning.
Mains 2015
Question: Mumbai, Delhi, and Kolkata are the three mega cities of India, but the air pollution problem is much more severe in Delhi compared to the other two. Explain why.
Mains 2013
Question: What do you understand by the concept of Carrying Capacity of an ecosystem? Explain how rapid urban expansion undermines this capacity in metropolitan areas.
Mains Practice Questions
[15 Marks | 250 Words]
Question: While the AQI Monitoring System provides highly transparent data to city residents, it lacks the statutory authority to independently punish industrial or municipal polluters. Analyze the institutional gaps in India's environmental governance regarding air quality enforcement.
[10 Marks | 150 Words]
Question: By locating the vast majority of continuous monitoring stations within Tier-1 metropolitan centers, India's current air quality management framework leaves rural and semi-urban tracking mostly unmapped. Discuss the consequences of this urban-centric monitoring focus.
[15 Marks | 250 Words]
Question: Evaluate the performance of the Graded Response Action Plan (GRAP) as an emergency regulatory filter. Suggest non-structural adjustments needed to make its execution more proactive rather than purely reactive.


National Air Quality Index-FAQs
What is the National Air Quality Index?
The National Air Quality Index is a public information tool launched by the Government of India to show air pollution levels in a simple format using one number, one colour and one health description.
Who launched the National Air Quality Index in India?
The National Air Quality Index was launched by the Government of India on September 17, 2014. It is monitored by the Central Pollution Control Board in coordination with State Pollution Control Boards.
What are the 8 pollutants measured under AQI?
The 8 AQI pollutants are PM10, PM2.5, Nitrogen Dioxide, Sulfur Dioxide, Carbon Monoxide, Ozone, Ammonia and Lead.
What are the AQI categories in India?
AQI in India is divided into six categories: Good, Satisfactory, Moderate, Poor, Very Poor and Severe, ranging from 0 to 500.
Why is Air Quality Index important for UPSC?
AQI is important for UPSC because it connects with air pollution, CPCB, NCAP, GRAP, public health, environmental governance, PM2.5, PM10 and sustainable urban development.